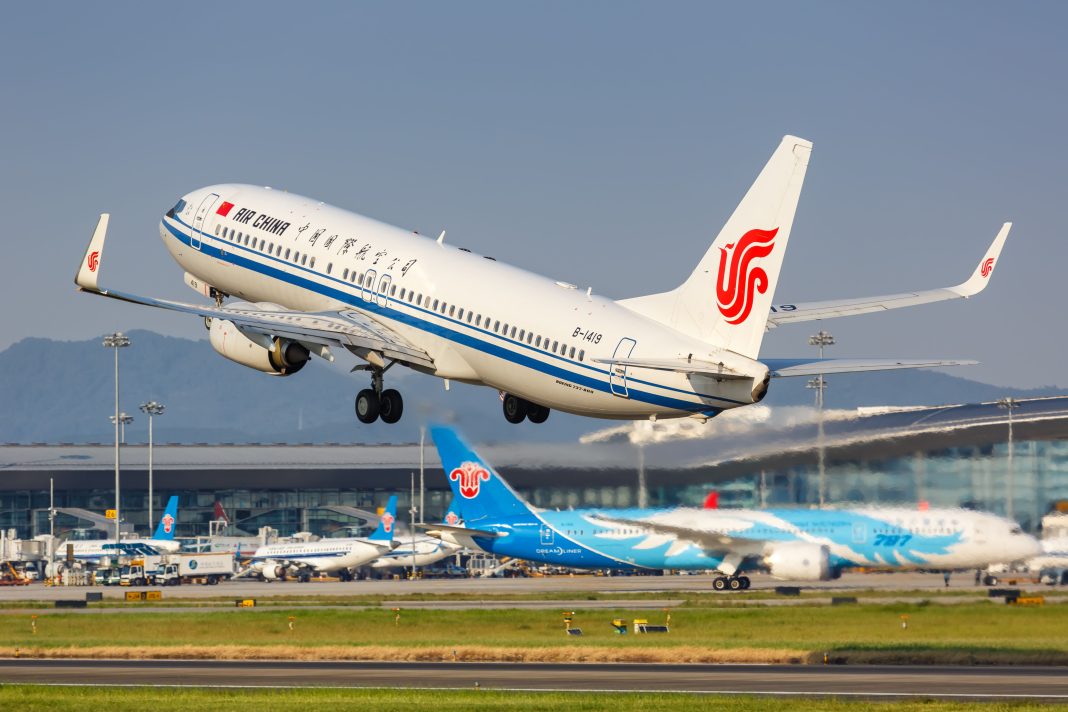
With China roaring back into global aviation, capacity in January is set to reach 427.1 million seats, just 7.7% below what it was in January 2019. The most recent figures, released this week, from schedules analyzer OAG show that capacity grew by 3.3% compared to December, with five of the 17 regions offering more capacity than they did in January 2019.
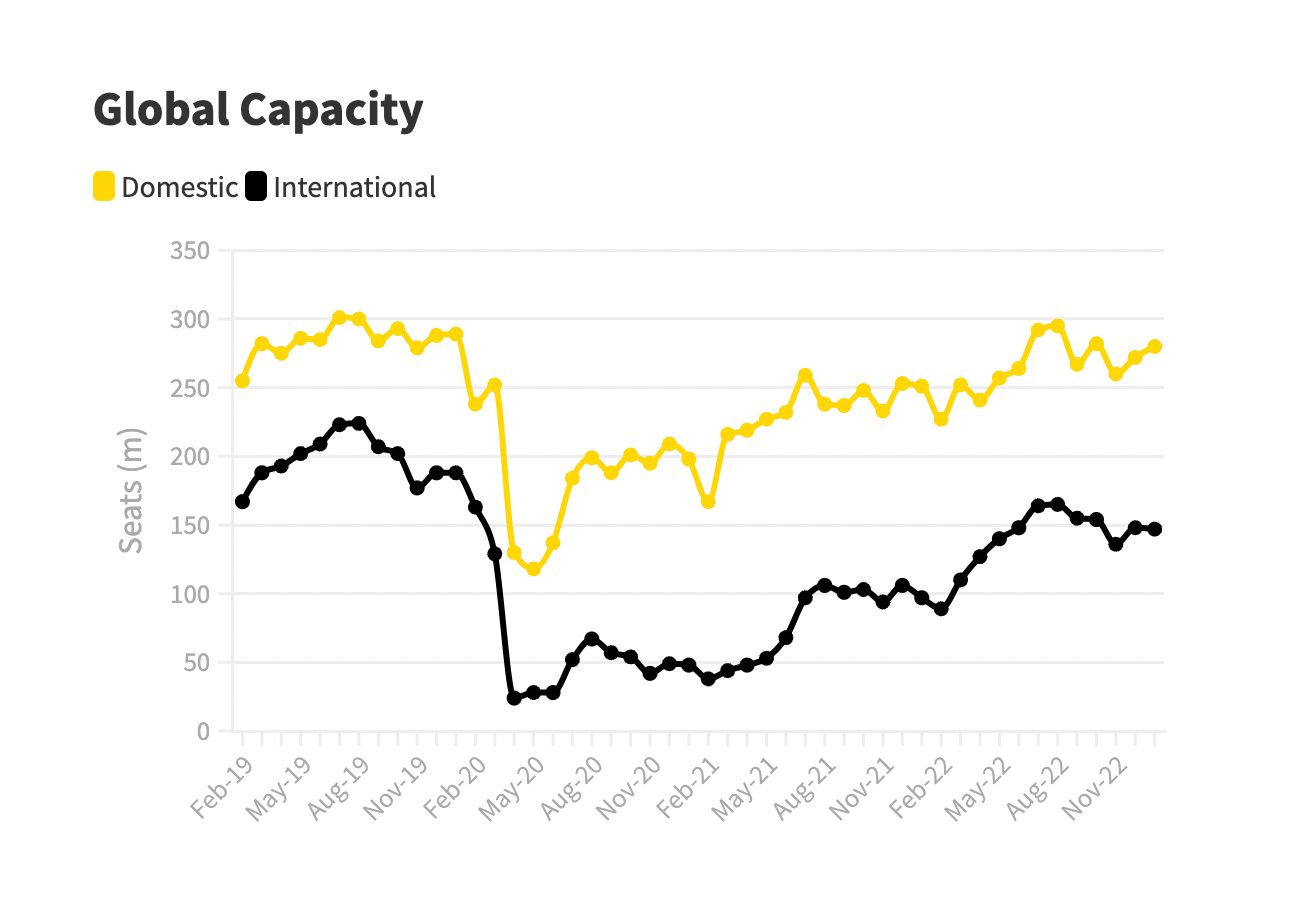
In terms of COVID-19 recovery, in January 2023 global domestic capacity is 7.7% behind January 2019 while international is at 11.8% behind.
Source: OAG
North America remains on top
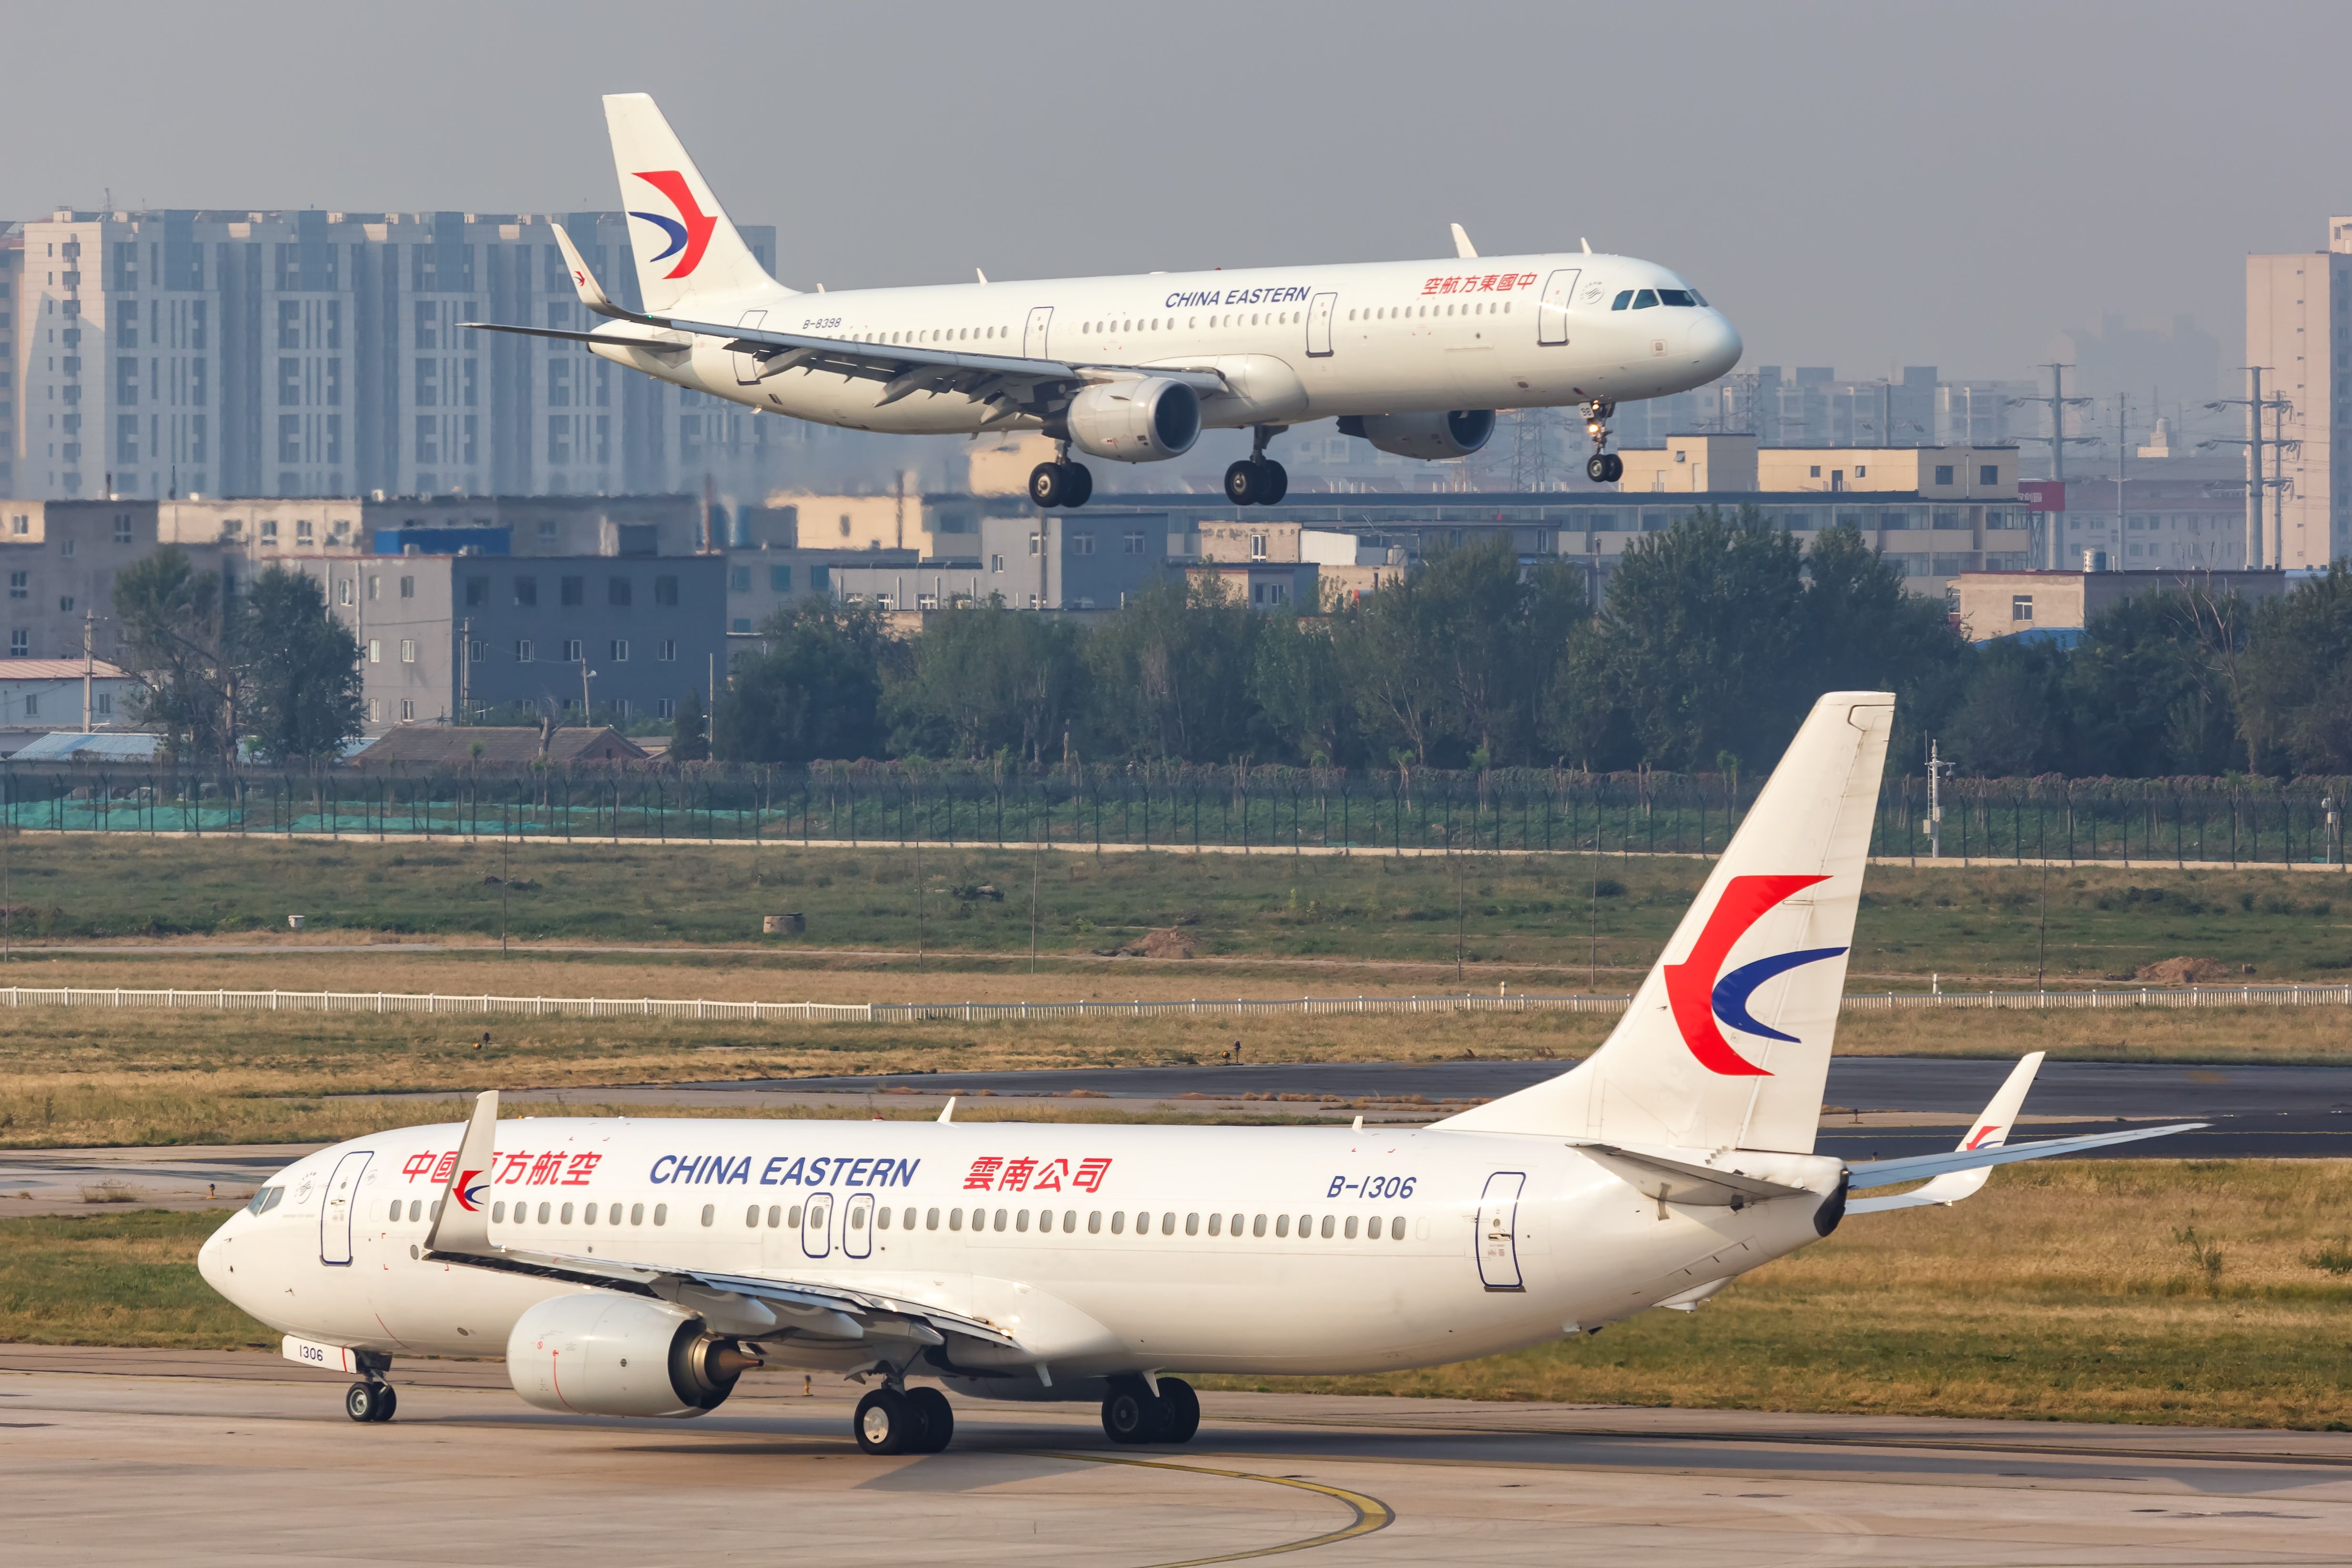
The largest region is North America, with 98.2 million seats, which represents 99.1% of pre-COVID capacity, followed by North East Asia, with 96.6 million seats or 92.5% of 2019 levels. North East Asia took off on the back of China announcing it was reopening its borders, adding 21.2% more capacity in January compared to the previous month. With the Lunar New Year season approaching, it is likely there will be another jump in this region next month, edging the aviation world ever closer to full COVID recovery.
There has been some rearranging in the pecking order for the five regions surpassing 2019 levels, although at +23.8% Central Asia remains at the top of the OAG recovery table. The others are Central/West Africa (+16.8%), Central America (+16.6%), Upper South America (+15.3%) and North Africa (+7.4%). Knocking on the positive progress door are South Asia (-0.1%), North America (-0.9%), Eastern Africa (-1.1%) and Latin America Caribbean (-4.2%).
Asia-Pacific recovery is taking off
Photo: Markus Mainka/Shutterstock
In January, Asia-Pacific has a capacity of around 166.6 million, or 39% of global capacity, compared to 98.2 million in North America and 73.8 million in Western Europe. Compared to December 2022, airlines in Asia-Pacific added around 11 million more seats in January. The regions with the most ground to make up to 2019 levels are Southern Africa (-25.6%), Eastern/Central Europe (-24.9%) and South East Asia (-20.8%).
Included in the Asia-Pacific figures is the Southwest Pacific, which includes Australia, New Zealand and the Pacific Ocean states. This region is still 14.2% behind 2019 levels, which is surprising given that the major airlines in the region, including Qantas, Virgin Australian and Air New Zealand, are operating close to pre-COVID capacity.
Mexico-USA route is a clear winner
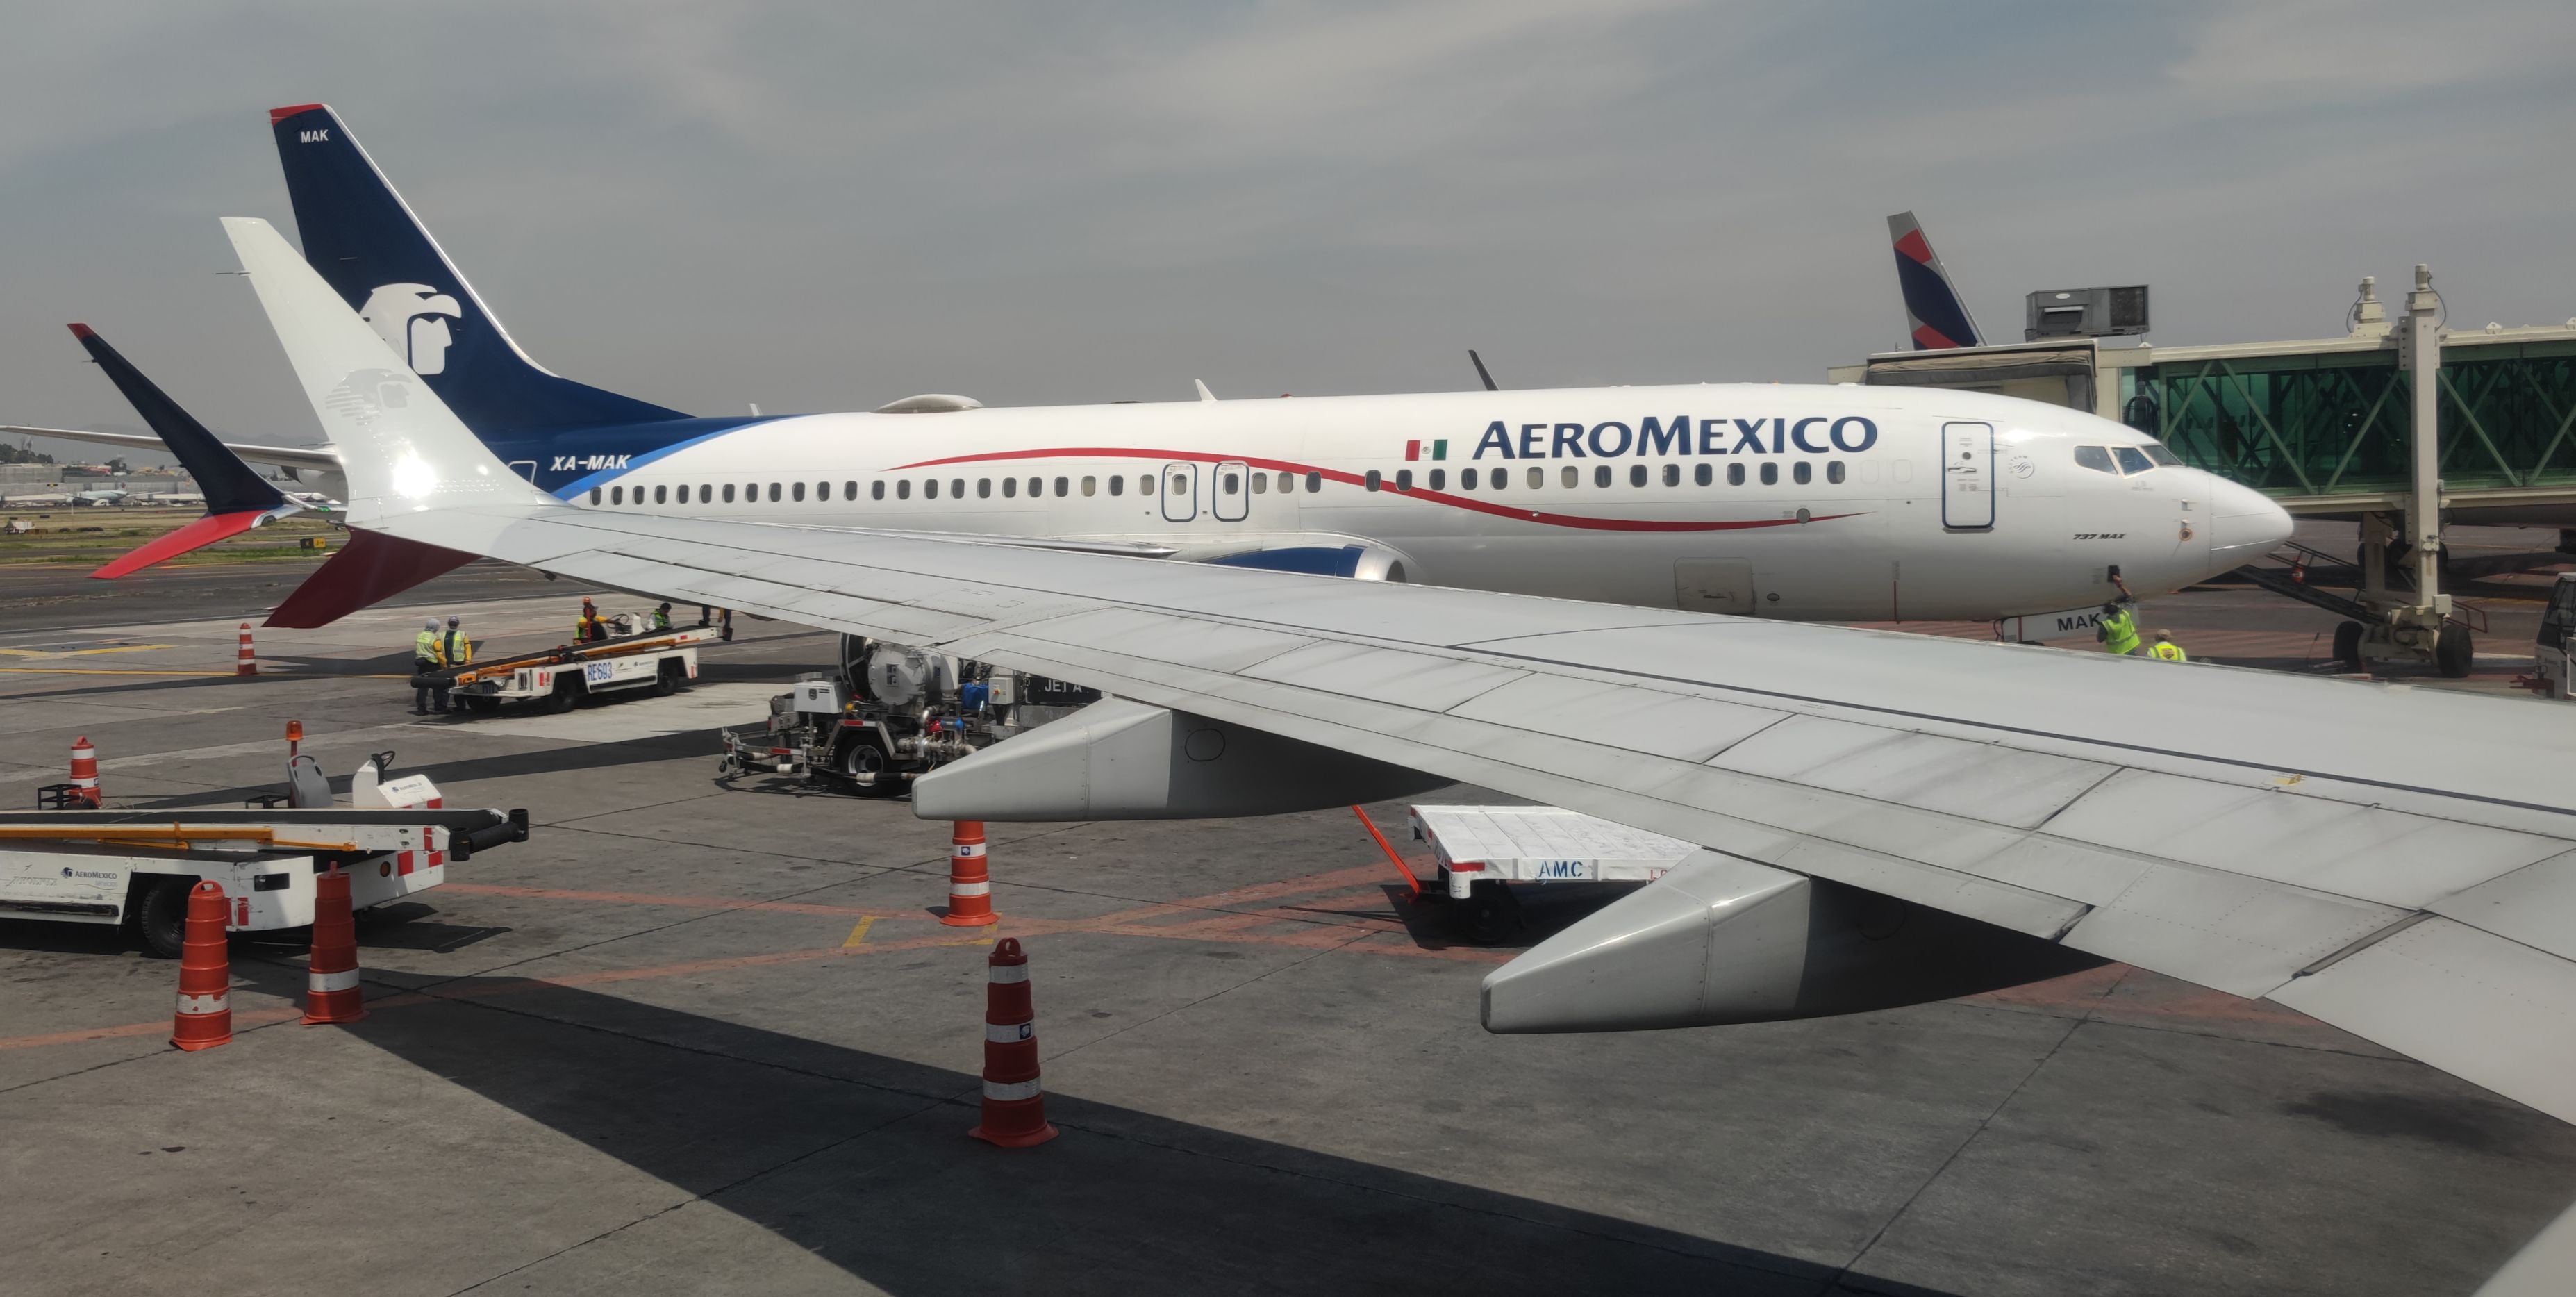
Photo: Daniel Martínez Garbuno | Simple Flying.
OAG’s top five country pairs are Mexico-USA, Canada-USA, Spain-UK, UAE-India and UK-USA. January 2023 capacity on the Mexico-USA routes totalled 4.02 million, which is 18.9% higher than it was in January 2019. With the holiday season long gone, capacity in Europe has fallen, typically down by 10-12% across Spain-UK, Germany-Spain, Spain-France and Germany-UK. Japan-South Korea remians the largest country pair in Asia, although it is more than 30% below what it was in January 2019.
The US remains the world’s largest domestic market with January cpacity of 79.29 million, around 2% above the 77.8 million it offered in January 2019. Chnia is gaining ground with capacity at 69.83 million, a 14% jump on January 2019 or an additional 8.8 million seats from pre-pandemic levels.
To illustrate the importance of the US and China domestic markets, the third largest market is India, which has capacity of 15.18 million this month, just 20% of the capacity offered in the US domestic market.
[ad_2]
Source link
