[ad_1]
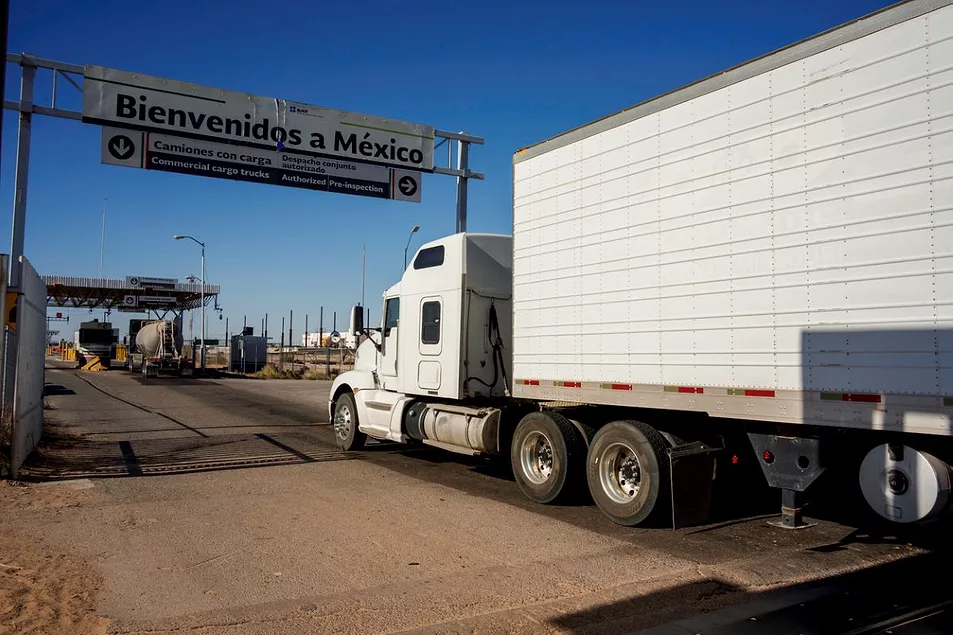
Border traffic is one of the earliest signals of economic activity. As trade policies evolve, the movement of goods and people across borders is often the first place that these policies are noticed – often weeks before consumers or producers see the effects, and certainly months before quarterly earnings.
To gain an early indicator of these trade policies, supply chain leaders and financial firms need more immediate indicators of these changes. That’s where real-time border-crossing data can offer an edge.
Changes in border traffic reflect how companies and consumers respond to uncertain economic times. For example, increases in commercial activity may indicate that consumers and businesses are stockpiling goods. Drops in outbound volume may translate to retaliatory action from outside the U.S. More personal vehicle crossings at borders can be an indicator of trade workarounds. What all these signals have in common is that they are visible days or weeks before traditional data catches up.
This type of intelligence falls outside the typical freight or customs data. It comes from physical movement, captured by connected vehicles, freight telematics, and mobility platforms that observe traffic flow at a granular level.
This isn’t just for finding anomalies; it’s about seeing them soon enough to respond in a timely manner. If companies wait for slower indicators such as port throughput reports, they may have wasted an opportunity to respond to the change or to make the right financial investment. Real-time monitoring offers a proactive posture in an otherwise reactive environment.
Implications Across the Value Chain
There are several ways this data can be used. Procurement teams can use border-crossing data to look for sourcing disruptions and changes in supplier routes. For instance, a sudden uptick in shipments through a port may suggest a supplier is changing its export behavior, perhaps due to cost, policy or enforcement pressure.
For transportation providers, directional shifts provide clues about evolving demand. A drop in southbound capacity paired with surging northbound volume can distort rates, driver availability, and trailer pool alignment. Rebalancing resources quickly allows carriers to maintain profitability and service levels.
Retailers and CPG brands can learn more about consumer behavior by reviewing and tracking traffic patterns. More crossings over a weekend at ports that are typically not as busy may suggest increasing gray-market activity, undermining official retail channels. Understanding where and how demand is being fulfilled off-book allows brands to recalibrate pricing, marketing, or enforcement strategies.
Investors are particularly finding value in border data. Persistent shifts in outbound traffic, like a decline in machinery exports, can act as leading indicators of macro trends such as slowing construction or infrastructure investment. These signals offer predictive value that, in many cases, outpaces corporate disclosures.
Why Border Crossings Beat Traditional Trade Data
Traditional trade monitoring has its limits. Government data often lags by weeks. Customs records capture goods that are declared but won’t reflect under-reported or informal traffic. Satellite imagery is useful, but is limited by weather. It’s also expensive, and often fails to show the trends that movement data can offer. Border wait-time metrics provide a view of congestion, not throughput.
On the other hand, real-time mobility data captures volume, direction and vehicle class continuously. It provides a more detailed snapshot of cross-border commerce by allowing companies to spot trends before they materialize elsewhere. Combining this data with machine learning techniques enables supply chain leaders to detect anomalies at scale, identifying patterns that human analysts might miss.
In an unstable trade environment, companies need every advantage they can get. Real-time insights from border crossings allow them to re-route shipments, renegotiate supplier terms, or rebalance inventory before the ripple effects settle in.
Watching the border isn’t just smart; it’s strategic. Every policy shift sends a ripple through the flow of vehicles crossing into and out of the country. If you’re paying attention, you can spot the story as it’s being written, long before it shows up in the data. The people following the data will be the ones who will see what’s coming first.
Michael Cottle is SVP Enterprise and Auto at INRIX.
[ad_2]
Source link


