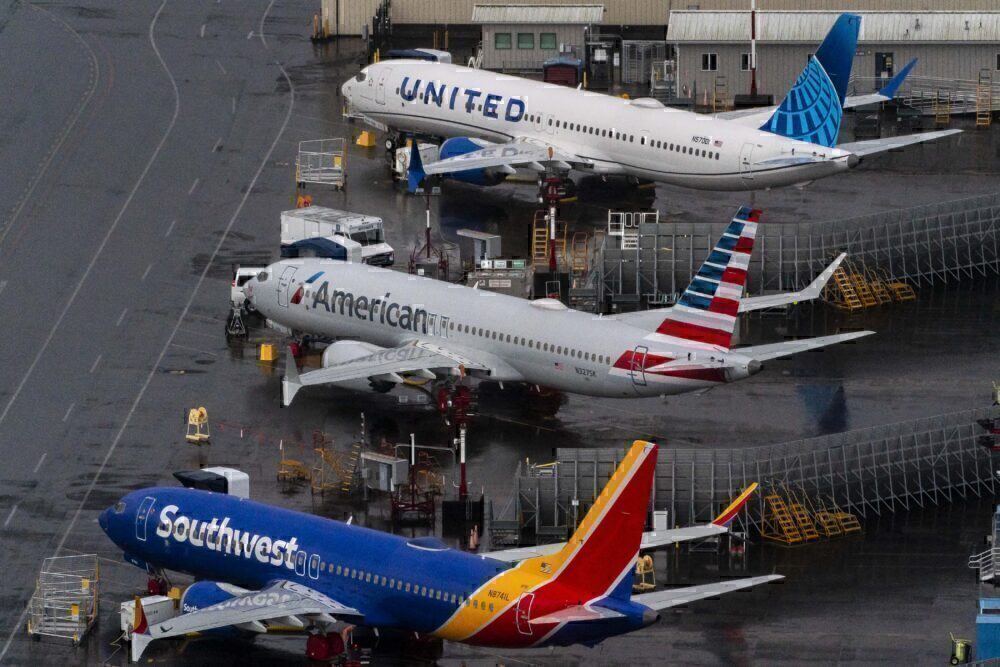
Most US airlines have already reported their 2020 financial results. Unsurprisingly, every carrier struggled amid a weak demand environment that led to steep losses and drastic cuts in capacity. Simple Flying takes a look at airline results from 2020.

The core losses
All major airlines reported a loss for the full year of 2020. From the highest loss to the least, the results are:
- Delta Air Lines ($12.4 billion)
- American Airlines ($8.9 billion)
- United Airlines ($7.1 billion)
- Southwest Airlines ($3.1 billion)
- Alaska Airlines ($1.3 billion)
- JetBlue ($1.3 billion)
- Hawaiian Airlines ($511 million)
Delta, American, and United all reported massive losses, in large part due to their large international exposure. International travel was one of the first revenue streams to shut down. If you remember, back to early 2020, carriers pulled capacity to China, followed by South Korea, Iran, Italy, and then expanding to cover most of Europe and then destinations in Latin America and Africa.

Domestic shutdowns did not happen until mid-to-late March when states started going into lockdown, and people began to severely restrict their movement. So, carriers with large domestic exposure, which are Southwest, Alaska, and JetBlue, started to feel the crunch. Hawaiian, which does have a fair bit of domestic exposure, also started to feel the pain as Hawaii remained shut for quite some time.
The shutdowns in travel themselves led airlines to pay out staggering, unprecedented refunds to customers for operational adjustments, and carriers saw an unprecedented slowdown in future bookings.

What about capacity?
All airlines cut down capacity, but airlines fiercely competed on capacity. Here’s where they landed in terms of capacity measured available seat miles (ASMs):
- American Airlines (143.2 billion ASMs)
- Delta Air Lines (134.3 billion ASMs)
- United Airlines (122.8 billion ASMs)
- Southwest Airlines (103.5 billion ASMs)
- Alaska Airlines (37.1 billion ASMs)
- JetBlue (32.7 billion ASMs)
- Hawaiian (7.5 million ASMs)
It is clear that American, Delta, and United continue to lead the way with capacity in the US, followed closely by Southwest Airlines. Combined, these four airlines have the most domestic connectivity of these carriers with hubs across the country.

Alaska Airlines is mostly a West Coast-based carrier, while JetBlue focuses on the East Coast, though it has also turned its attention to more transcontinental and some West Coast flying. And, lastly, Hawaiian Airlines focuses entirely on bringing passengers to and from the Hawaiian islands.
It is more helpful to view capacity in terms of change from 2020 to 2019:
- Hawaiian Airlines (down 63.4%)
- United Airlines (down 56.9%)
- Delta Air Lines (down 51%)
- American Airlines (down 49.8%)
- JetBlue (down 48.8%)
- Alaska Airlines (down 44.3%)
- Southwest Airlines (down 34.2%)
Unsurprisingly, Hawaiian Airlines cut the most capacity. It had to shut down its entire international network and follow with a shutdown of its domestic network from essentially spring through October as Hawaii mandated a strict 14-day quarantine for island arrivals.

Southwest Airlines has maintained more capacity than the other airlines in part because the airline is mostly domestic in terms of its network and exposure. Since domestic travel is coming back far quicker than international, Southwest has capitalized on this by flying a significant amount of domestic capacity.
PRASMs
PRASM stands for passenger revenue per available seat mile, which is an important metric for airlines. This is one of the most heavily thrown-around terms in the industry and is a good metric of an airline’s ability to command a revenue premium.
Airlines that have higher PRASMs generally have more control over their pricing. Essentially, carriers can charge more for their product. Expressed in cents, here is how airlines landed on PRASM for the year:
- American Airlines (10.14 cents)
- United Airlines (9.61 cents)
- Delta Air Lines (9.59 cents)
- Hawaiian Airlines (8.83 cents)
- JetBlue (8.36 cents)
- Alaska Airlines (8.1 cents)
- Southwest Airlines (7.41 cents)
Southwest Airlines is known for its low fares, so its lower PRASM represents its structure as a low-fare carrier. It is important to note that a comparatively lower PRASM does not necessarily equal a lower profit. American, United, and Delta led the way with higher PRASM, which is indicative of their ability to cater to more expensive business class and corporate customers who would otherwise shy away from flying an airline like Southwest.

However, United, Delta, and American typically command PRASMs north of 10 cents, so these numbers represent that carriers are selling fewer higher-cost tickets, which makes sense. Airlines are managing a balancing act with lowering their fares in an attempt to get more passengers onboard their planes.
Load factor
An airline’s load factor is an important metric. A term of performance, it essentially boils down to what percentage of an airline’s seats were sold and filled. Here’s the load factor for the full year that US airlines reported for 2020:
- American Airlines (64.1%)
- Hawaiian Airlines (60.6%)
- United Airlines (60.2%)
- JetBlue (56.9%)
- Alaska Airlines (55.2%)
- Delta Air Lines (55%)
- Southwest Airlines (52.4%)
Southwest, Delta, and Alaska held load-factor caps the longest in the industry. Southwest ended its load factor caps in December, and Alaska Airlines stopped its caps in early January. Delta is the only carrier that has committed to blocking seats for sale on its planes. JetBlue also phased out seat blocks recently. Hawaiian Airlines also stopped blocking seats.

United never really blocked seats on its planes, and American ended its load caps in early summer. Load factor caps are not conducive to profitability. Still, carriers that did cap their loads were hopeful of getting a revenue premium and also showing customers they were carriers focused on safety ahead of profitability.
Airlines were also buoyed by the first quarter, with carriers seeing mostly higher load factors until the tail-end of the quarter. For example, Hawaiian Airlines, despite facing a massive shutdown of travel to and from Hawaii, recorded a nearly 75% load factor in the first quarter.

What about CASM?
Another PRASM-style figure that is important is the cost per available seat mile (CASM). This helps show the airline’s cost base, and airlines want to keep this as low as possible. Here’s where airlines were in 2020:
- Hawaiian Airlines (18.35 cents)
- American Airlines (17.69 cents)
- United Airlines (17.13 cents)
- Delta Air Lines (15.61 cents)
- JetBlue (13.12 cents)
- Alaska Airlines (12.25 cents)
- Southwest Airlines (11.77 cents)
The above CASM is ex-fuel and special items, which gives a better indication of the airline’s main cost base. CASM was higher in 2020 than in 2019, mostly because of an airline’s operating costs. According to the IATA, costs were higher in 2020 than in 2019 per available seat mile because airlines could not “spread” costs over large capacity bases.

According to IATA, jet fuel prices started high in 2020, hit rocked bottom in April and May, when demand was also incredibly low for jet fuel, and then increased through the end of the year and into 2021. So, coupled with higher costs, it is clear that airlines’ CASMs outpaced their PRASMs and even TRASMs (total revenue per available seat mile).

2020 was a rough year for airlines
There is no way to get around the fact that 2020 was rough. With capacity down, cost-cutting not proving to be enough to turn a profit for airlines, and passenger revenue at their lowest levels in history, carriers did what they could to minimize losses. Until there is sustained passenger growth, airlines will still be in a tough position.
Were any of these statistics surprising to you? Let us know in the comments!
[ad_2]
Source link


